Hack MIT – a recap
Last week, Kelly, Guy, and I attended HackMIT – one of the most prestigious hackathons in the world – as sponsor judges for the Big Data Initiative at MIT CSAIL. There, we listened to speeches, mentored students, and (importantly) encouraged students to hack on our newly released wifi data.
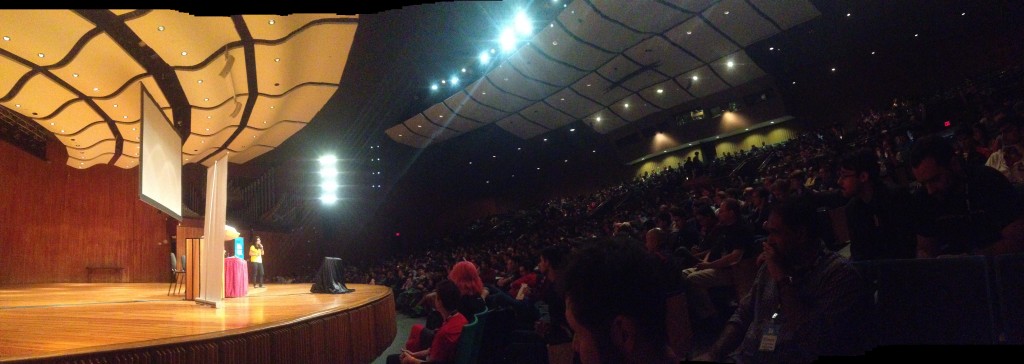
Kenote presentation by Adora Cheung, co-founder and CEO of Homejoy
Oh. What’s that? You didn’t hear? The Big Data Initiative, in coordination with MIT’s IS&T released the coordinates of approximately 4700+ wifi access points on MIT’s campus; along with the number of devices at each wifi point over time. For HackMIT, we put together a webpage linking to this information, useful API’s, and example projects for participants to learn from. You can see example projects from Eugene Wu, Kelly Zhang, and Jameson Toole on that page.
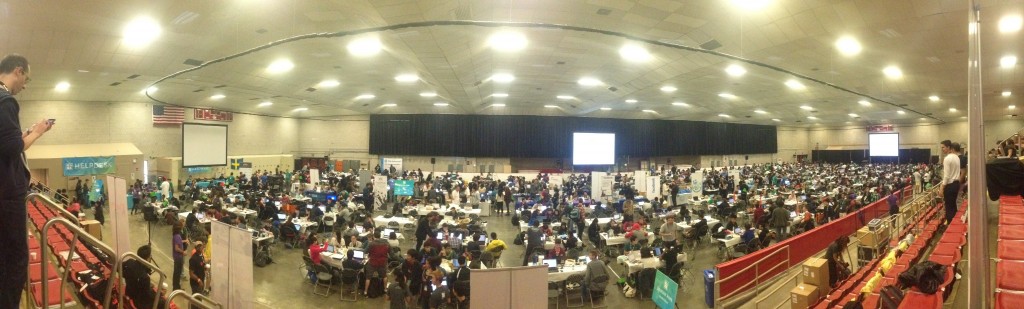
A panorama picture of the gym floor at HackMIT 2014
Seven teams awarded our efforts by indicating that they had made use of the data, applying for the prize, and giving us some extremely caffeinated presentations. Here are our favorite four:
ClassiFi (our winner!):
ClassiFi used wifi data as a measure of class attendance. Given an MIT Course number, their program determined the days and times that the class met, and the classrooms that it met in. It aggregated the data and created some beautiful attendance graphs. Unsurprisingly, class attendance rose before class exams.
The source code is not yet public, but ClassiFi’s members expect it to be soon.
Beaver Dash (the HackMIT Grand Prize Winner):
Beaver Dash used wifi data and several other apis to create a set of tools around MIT’s free food and reuse email lists. Using wifi and location data, the tool is able to estimate a user’s likelihood of reaching the free food or discarded office equipment before other student competitors. Beaverdash used a Ruby on Rails stack to put together their project. You can find their source code here.
Fun with Wifi Data:
Fun with Wifi Data was an impressive one-person operation. The participant used matlab to do some excellent parsing of the wifi data, correctly identifying trends like where people went for lunch and at what time they took lunch in different buildings. Some places -cough- Building NE49 -cough- have a particularly large lunch exodus.
Oculus WiFi
This team created a three dimensional representation of campus, visible through the Oculus headset, and navigable through gesture-controlled Myo armbands. It was very very cool. All 4700 wifi access points were visible, but unfortunately, we weren’t able to see live wifi activity on campus. The amount number of data points involved was (not surprisingly) simply too large, and crashed their machine.